API-Analytics
There have been two reasons why we did switch from APIv1 to APIv2. Besides improved security the ability to provide differentiated metering has been one of the main drivers behind the introduction of APIv2.
With APIv2 you can
- Identify keys by name, which is improving and simplifying logging and metering
- address more fuunctionality, we allow to manage the complete process through API
- assign scopes, reducing the impact of key loss and misuse
However, the new API comes with a strong analytics capability. You may see the usage by key, understand which key is causing how much transactions, and which. You also may receive monthly reports by mail allowing to associate a cost breakdown by user. But let's start step by step.
Individual Key Statistics
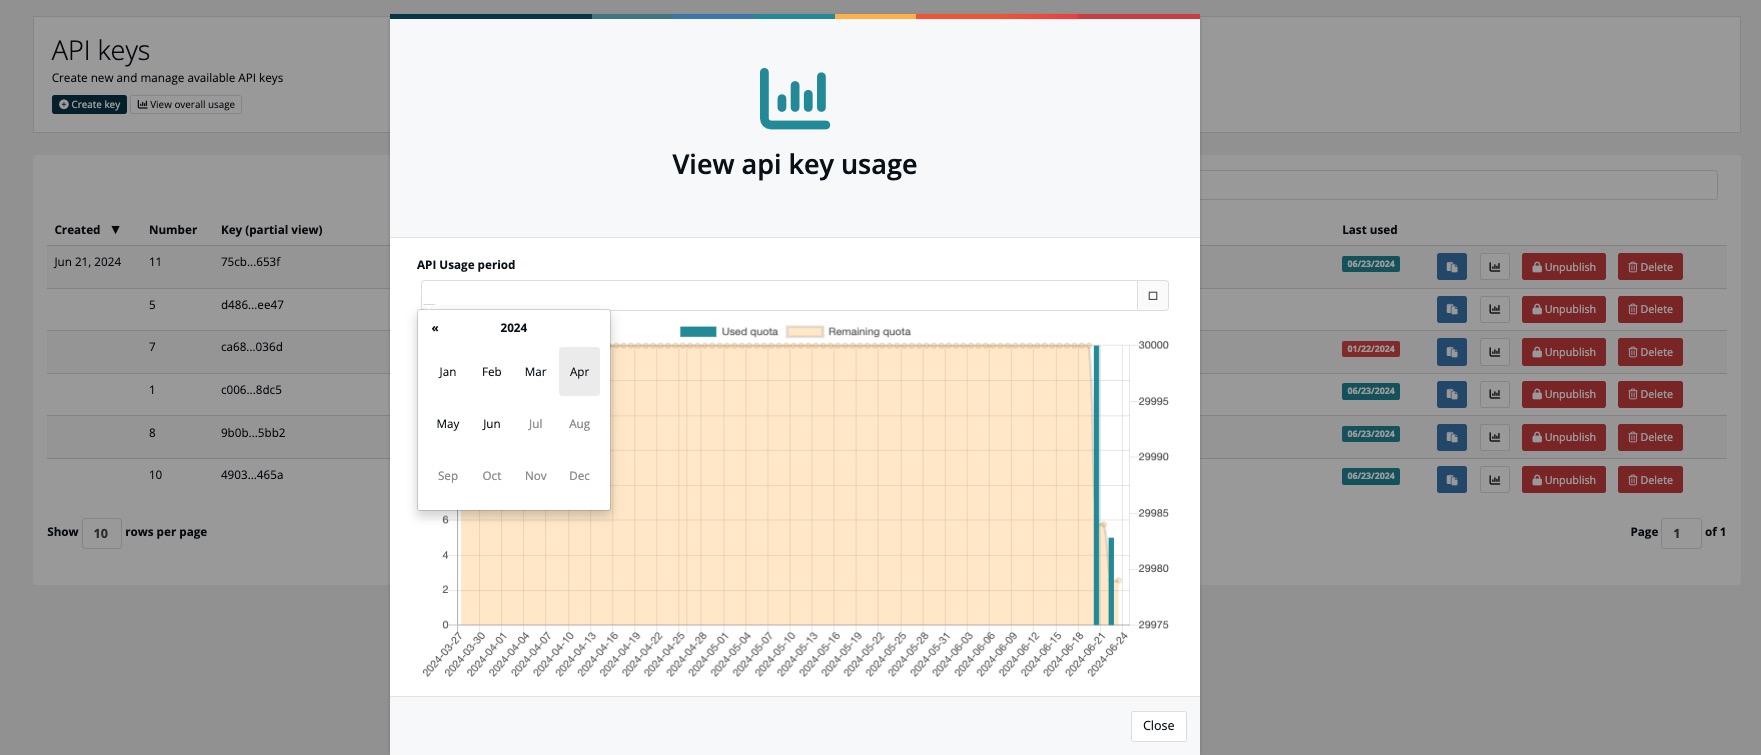
Strating point for all analytics will be the API Key Management page under > ADMINISTRATION > Scanners & API Keys > API Keys. Behind each key you see a small diagram symbol  . Clicking on the symbol will open a modal window displaying the use of the key during the current month.

It is possible to select different reporting periods. The green bars show the usage of the sleected key. The yellow background shows the remaining quota for the selected reporting period.
[!NOTE]
Expect the data to be from a day before. For performance and security reasons we decided not to use realtime data. Thus it may be, that you are missing the latest requests.
Overview of all Keys
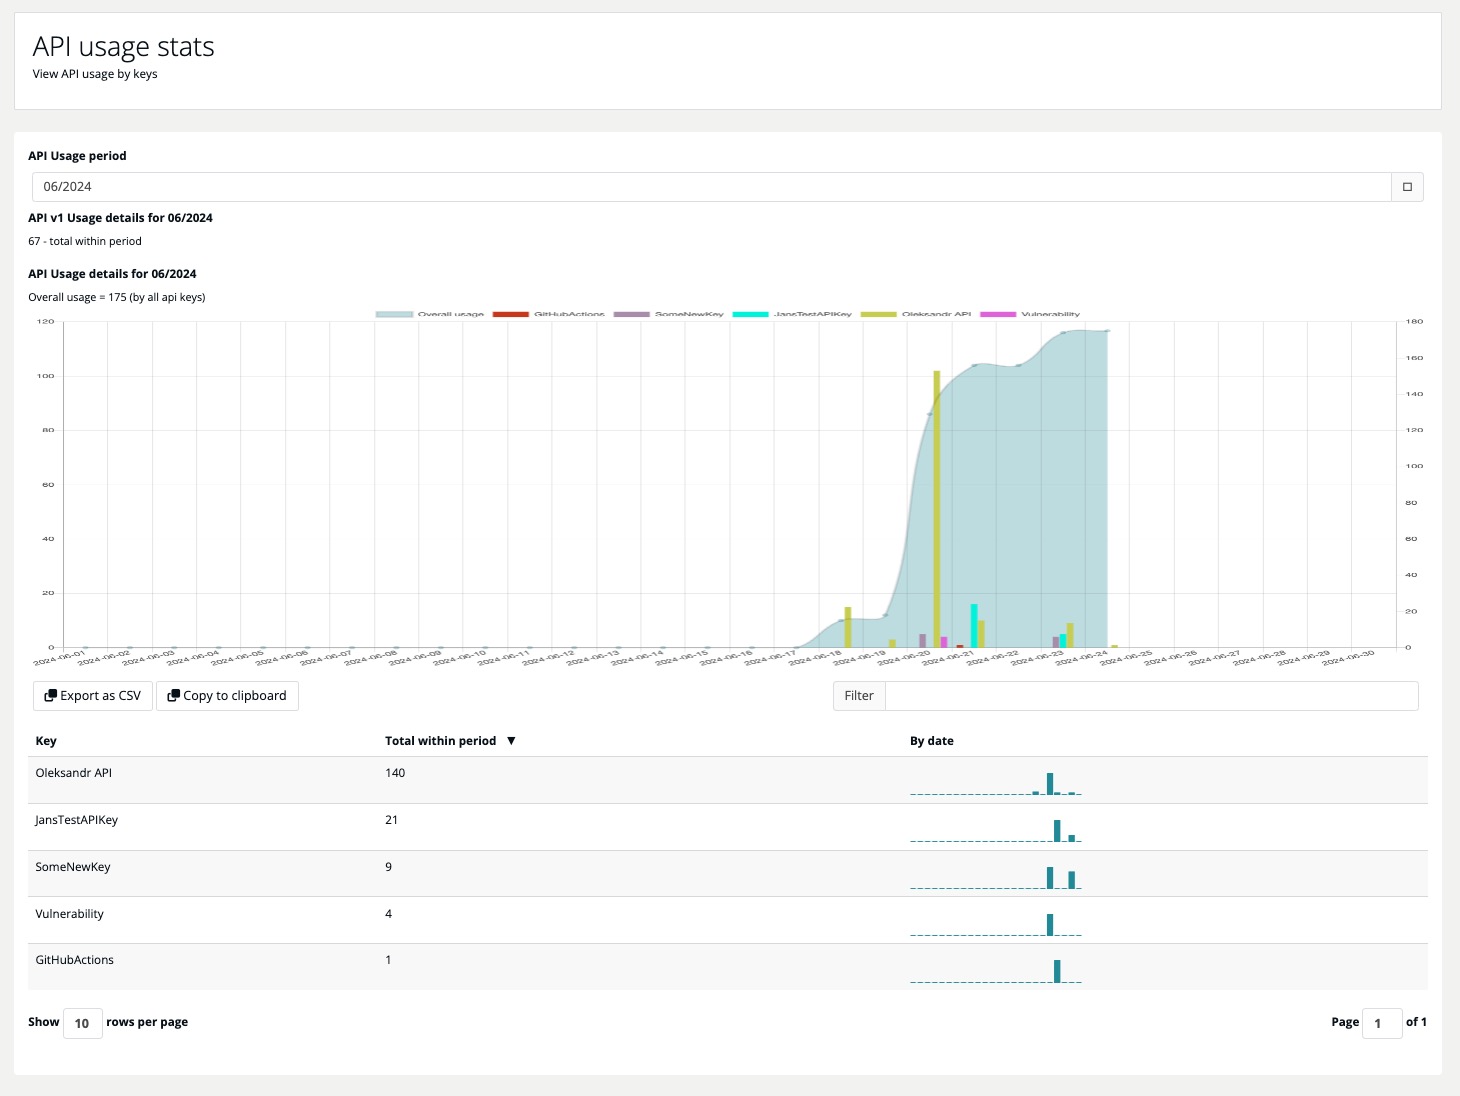
Below the page title you see the two action buttons "Create Key" and "View overall statistics". As soon as you have created one key, you will be able to open the usage statistics.

In the upper left corner you will see the selected usage period. Display scope is monthly. Switch the usage period by selecting another month from the dropdown.
Below you see the summary of the APIv1 calls. Unfortunately, we are not able to gove further details about single keys, since the logging and reporting is structured differently. However, until the end of the year, wou will find the total of all API v1 during the reporting periond being displyer here. Make sure, it will be 0 before End of September 2024!
The diagram below shows the usage by key and day of APIv2 keys. While each column displayed is the usage for that particular day, thecummulated area in the background shows the number of requests. Below the diagram you have the option to export the result either as CSV or copy the data directly into clipboard to transfer it into numbers or excel without downloading a CSV-file. The reuslt file will contain the same data as the table below the diagram: a sum and a count per day for each active key.
Given you are using several dozens of keys the diagram will not be very useful anymore. To get access to particular key, you may apply the filter, below the image at the right. Start typing any sequence contained in the key name and you will get the list filtered for matching keys only.